
Pencil Geek has a new feature! Vbox Dyno

Thread Starter
|
Registered User
Joined: Aug 2014
Posts: 1,062
From: Austin, Tx
Rep Power: 124


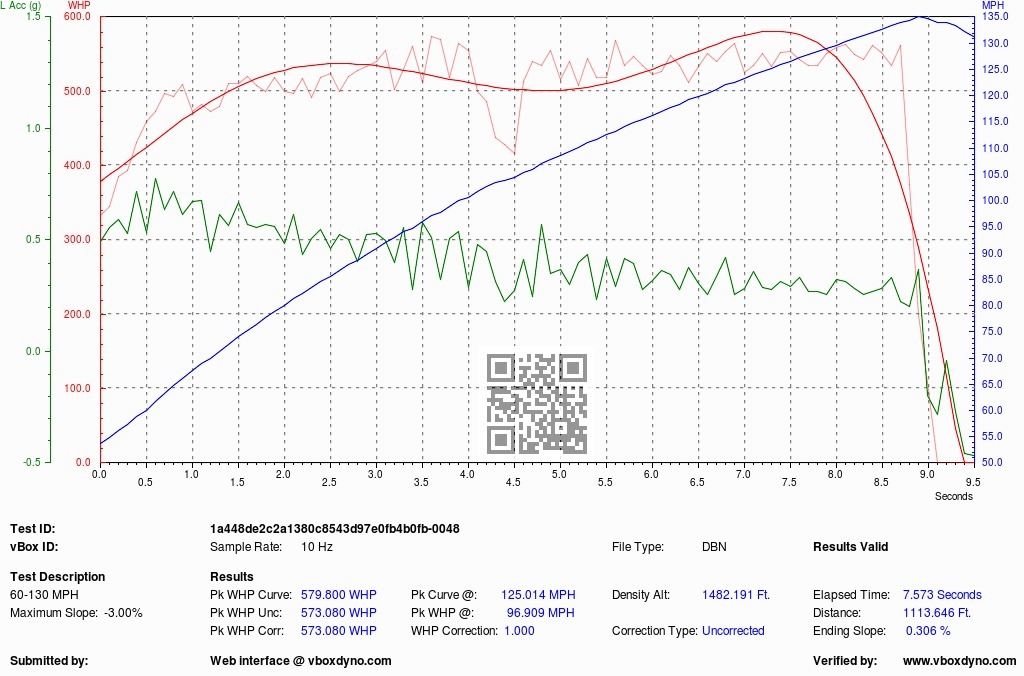
But because it's a polynomial equation that produces a best fit curve, it's possible that you can end up with higher "average" whp than peak whp. It's rare, but yes that can happen. Bottom line, it's not a bug but just the way poly-fit curves turn out sometimes.
The alternatives are to rename "avg whp" to something else. I toyed with this idea, but it's a little too geeky to call it "poly fit whp" -- and I don't think anybody would understand what that means anyways. You would never want to calculate a true average whp anyways because unless you have a flat whp curve, then your lower whp output will always dominate the higher whp output. The resulting average would be way too low.
When I developed the poly-fit, I did use Excel spreadsheets with all the data from the vBox Dyno. It was pretty cool to see the vBox Dyno poly-fit perfectly mirror the Excel poly-fit graph.
So you could call them peak calculated and peak estimated I think, if I am understanding correctly what the two red plots are.

Thread Starter
|
Registered User
Joined: Aug 2014
Posts: 1,062
From: Austin, Tx
Rep Power: 124
I think that would be better at least it wouldn't be confusing where the average appears to be higher than peak. It's just two different representations of hp which you might mention on the dyno page. The computed version is fairly noisy while the curve is smoother and sort of tries to filter out the variation.
You might also call one raw and the other fit. I have a suggestion for you though and I am not sure how well it would work but it might be worth trying. You could use a low pass FIR filter to process the raw data and see how that looks. It would filter out the high frequency changes and leave the DC component along with the lower frequency changes, similar to the polynomial. You could also instead of using the orthogonal polynomials try something like the Remez exchange if you wanted to get a better fit. A minimax approximation will generally give a better function but may not converge on some of these data sets. I think a FIR filter would give you a better smoothed version and there won't be issues with convergence. The key is to pick the passband and the proper corner frequency.
One way to do that would be to FFT the data and see what frequencies are in a few data sets. That would give you an idea of where the frequencies of interest are. Since you are going to be getting either 10hz data or 20hz data, you could use two different filters depending on the sampling frequency. I think probably a 3hz corner frequency with a 5hz passband would be OK and you could use a steep filter so you get fairly high attenuation of the stuff above the passband. That is the beauty of an FIR filter, they can be pretty steep.
Last edited by wrs; May 12, 2016 at 06:19 AM.

Thread Starter
|
Registered User
Joined: Aug 2014
Posts: 1,062
From: Austin, Tx
Rep Power: 124
If you have a Vbox or Performance Box it's really easy to use. Just upload your file to his website. It's strictly for the RaceLogic products though.

Thread
Thread Starter
Forum
Replies
Last Post

