

Q for Durametric Datalogging Experts: Explain "Engine Load" + Conversion to HP


Registered User

Joined: May 2010
Posts: 466
From: Los Angeles
Rep Power: 58


I get 265ish on all boost levels 1.7 and above.. so far i have cranked it up to 2.14. On pump(91) and meth (1.81Bar - I see 262 as the highest) .. anything after 1.87 BAR I logged with 100 and Meth.

Registered User
Joined: Oct 2008
Posts: 2,321
From: Fastlane USA
Rep Power: 246
Does yours peak between 5100-6000 rpm (260-265 load)? I've seen that number on others with 3076s around 1.7 bar. Are you not feeling any more torque at higher boost? I would think it should continue to increase with boost?
Registered User
Joined: May 2010
Posts: 466
From: Los Angeles
Rep Power: 58
4900-5900 .. I have no seen any higher ...267 is the peak I have seen and it is NOT on the 2.14 BAR it is actually on the 1.87
Thread Starter
|
Registered User
Joined: Dec 2006
Posts: 3,116
From: Palos Verdes
Rep Power: 256
Ari, it might even get better. I have a Mustang dyno of my tune so we could put the "theory" to the test: draw a graph of Durametric's engine load on top of my Mustang torque curve and see how close the shapes track each other.
Mine is just one data point though, subjected to errors; I wonder if other people have done the same to see how close the 2 values (dyno's torque vs. Durametric's engine load) are?
Mine is just one data point though, subjected to errors; I wonder if other people have done the same to see how close the 2 values (dyno's torque vs. Durametric's engine load) are?
Registered User
Joined: May 2010
Posts: 466
From: Los Angeles
Rep Power: 58
Ari, it might even get better. I have a Mustang dyno of my tune so we could put the "theory" to the test: draw a graph of Durametric's engine load on top of my Mustang torque curve and see how close the shapes track each other.
Mine is just one data point though, subjected to errors; I wonder if other people have done the same to see how close the 2 values (dyno's torque vs. Durametric's engine load) are?
Mine is just one data point though, subjected to errors; I wonder if other people have done the same to see how close the 2 values (dyno's torque vs. Durametric's engine load) are?
 )
)1.81 BAR - 91 + Meth
2642.5 107.06
2693.5 107.18
2702.75 108.12
2747.25 109.13
2796 109.92
2806.25 111.12
2857 112.22
2899.75 113.13
2922.5 114.49
2969 115.71
3021.75 116.79
3057.25 117.89
3099.25 119.27
3141.75 120.68
3176.5 122.41
3227 124.08
3269.5 125.93
3320.75 127.66
3364.25 130.43
3412.5 133.24
3467.25 136.05
3513 139.38
3577 142.92
3628.25 146.51
3678 151.97
3755.25 159.05
3814.25 165
3896.5 173.06
3961.75 182.55
4047.25 193.62
4108.25 205.9
4184.75 219.7
4314.75 231.98
4401.25 239.77
4445 240.7
4554.5 244.34
4654.5 248.44
4774.5 250.64
4855.25 254.04
4973 258.05
5033 260.16
5188.75 259.85
5772.25 253.17
5371.5 260.88
5501.75 257.67
5505.25 261.91
5606.5 261.63
5665 261.26
5741.75 259.69
5883.5 257.81
5919.75 257.93
6043 253.13
6097.5 250.64
6209.5 243.94
6338.5 239.65
6308.25 241.01
6464.75 230.23
6547.75 231.19
6544.5 229.76
6592.75 222.47
6711.25 212.88
6773 214.27
6971.5 215.11
6873.75 214.8
6961.75 214.24
7084 214.2
Registered User
Joined: Oct 2008
Posts: 2,321
From: Fastlane USA
Rep Power: 246
Ari, it might even get better. I have a Mustang dyno of my tune so we could put the "theory" to the test: draw a graph of Durametric's engine load on top of my Mustang torque curve and see how close the shapes track each other.
Mine is just one data point though, subjected to errors; I wonder if other people have done the same to see how close the 2 values (dyno's torque vs. Durametric's engine load) are?
Mine is just one data point though, subjected to errors; I wonder if other people have done the same to see how close the 2 values (dyno's torque vs. Durametric's engine load) are?
Champion Dyno 68s

VE Calculation

Last edited by TTdude; Jun 16, 2013 at 11:40 AM.
Registered User
Joined: Oct 2008
Posts: 2,321
From: Fastlane USA
Rep Power: 246
Not bad Ari! -- Don't shift next time. Just do 4th gear pull, just like dyno.
PS nice load curve -- your car must feel very strong!
PS nice load curve -- your car must feel very strong!
Last edited by TTdude; Jun 16, 2013 at 11:44 AM.
Thread Starter
|
Registered User
Joined: Dec 2006
Posts: 3,116
From: Palos Verdes
Rep Power: 256
Asking so I understand this better: the lower curve is VE data from the same dyno, not from a separate *street* Durametric datalogging, right?
The reason I ask: it looks identical to the torque curve on the dyno sheet - even the little bumps on the curve.
What I am graphing is *dyno* torque versus *street* Durametric datalogging - not that it's "better," but to see how closely amateur Joe with Durametric could approximate a pro's dyno.
Registered User
Joined: Oct 2008
Posts: 2,321
From: Fastlane USA
Rep Power: 246
Dave,
Asking so I understand this better: the lower curve is VE data from the same dyno, not from a separate *street* Durametric datalogging, right?
The reason I ask: it looks identical to the torque curve on the dyno sheet - even the little bumps on the curve.
What I am graphing is *dyno* torque versus *street* Durametric datalogging - not that it's "better," but to see how closely amateur Joe with Durametric could approximate a pro's dyno.

Thread Starter
|
Registered User
Joined: Dec 2006
Posts: 3,116
From: Palos Verdes
Rep Power: 256
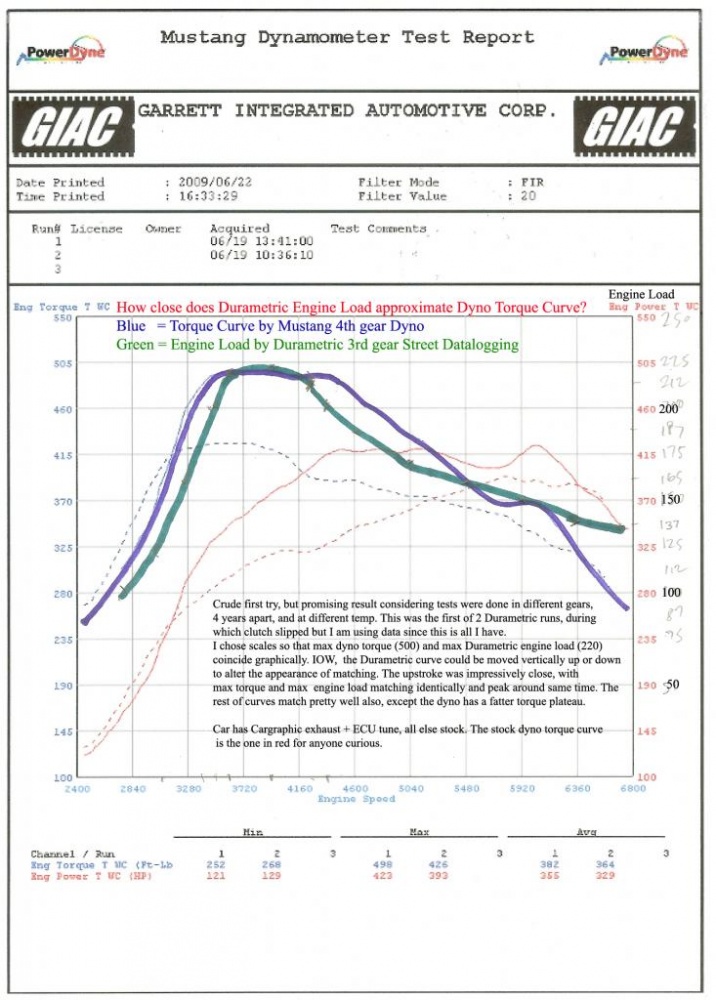
Thanks to Mod extraodinaire bbywu's fantastic help, and TTdude's explanation , I was able to run the following tests and graph the result. As always, any expert please feel free to correct as needed.
This particular post is not about power testing per se (although that is exactly what I am measuring); I am merely checking how well average Joe's Durametric street datalogging approximates pro tuner's dyno torque curve. Why is it important to me? If the match is close, it is evidence that this simpel test could be used not only to double check on your tuner's alteration to the program, but also to check any components (header, plenum, exhaust, etc.) you add to see if someone is blowing smoke up the a** (supposedly an actual attempted treatment for drowning in 18th century Europe :-)).
There were several limitations: the 2 test were done 4 years apart in vastly different conditions, this was my first time with Durametric and the number of runs were limited and were done in 3rd gear, not 4th gear, as I don't want to go to jail :-), etc.
Dyno: done in 6/2009, fan cooling with car stationary, 4th gear WOT on dyno, cooler ambient temp.
Durametric datalog: done in 5/2013, real world cooling with car moving, 3rd gear WOT on non-leveled road, hot desert day. I only did a total of 5 runs or so, a mixture of stock program and GIAC program.
Given the vastly difference conditions, I was impressed at the result and how consistent Durametric engine load value is. In both runs, the peak engine load hit 220. The graph of engine load versus torque are very close on up stroke and the maximum values of torque and engine load hit at near indentical rpm around 3500 rpm. The shapes don't match perfectly but I am certain with more runs, I would be able to producemore consistent results, enough to test components and tuners.
(PS Error in picture below, the stock torque curve is the one in blue with dash, not the red one.)

Last edited by cannga; Jul 10, 2013 at 12:40 PM.
Thread Starter
|
Registered User
Joined: Dec 2006
Posts: 3,116
From: Palos Verdes
Rep Power: 256
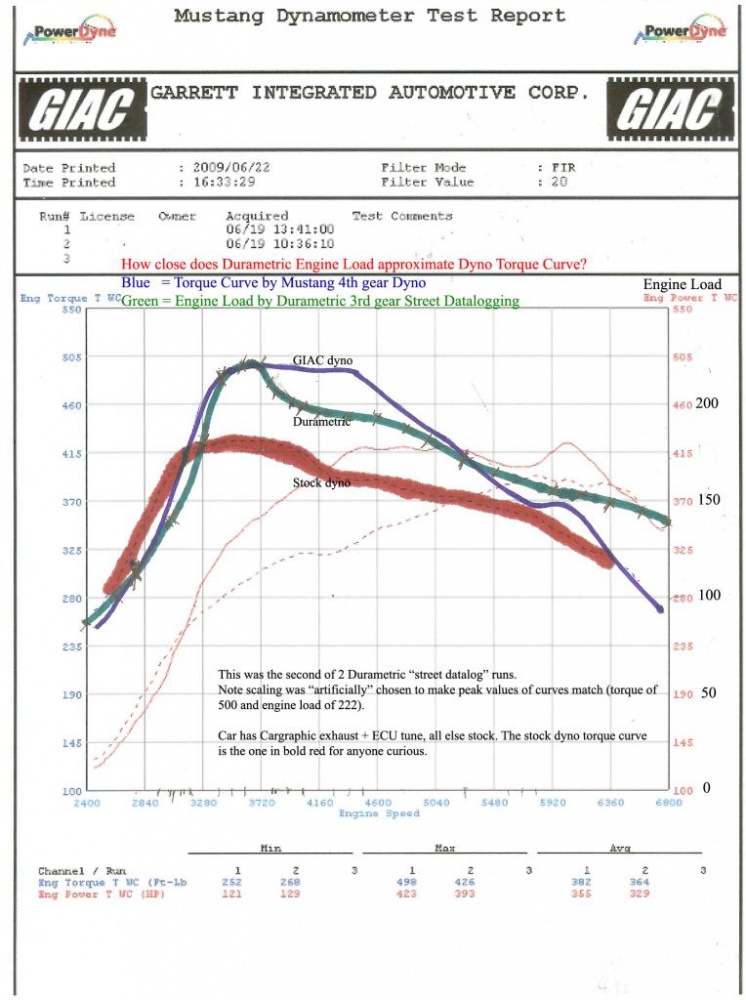
I did a few runs in a row without break in between at different power levels - Stock normal, Stock sport, GIAC normal, GIAC sport. This second GIAC sport curve (the one above was first) was the last run of the day. The upstroke of the curve has outstanding match, again peak engine load and peak torque came at same rpm and surprisingly consistent. Next part of the graph is not as pretty but as mentioned, given time and more trials, I believe I could get a "representative" curve that's good enough for evaluation.

Last edited by cannga; Jun 25, 2013 at 11:26 AM.

Thread
Thread Starter
Forum
Replies
Last Post
eclip5e
Automobiles For Sale
6
Jul 29, 2019 11:13 AM
nlakind
Automobiles For Sale
3
Nov 6, 2015 10:15 AM
sdg1871
991 Turbo
77
Sep 12, 2015 06:54 AM
ECS Tuning - VW
VW Vendor Classifieds
0
Aug 26, 2015 02:54 PM