When you click on links to various merchants on this site and make a purchase, this can result in this site earning a commission. Affiliate programs and affiliations include, but are not limited to, the eBay Partner Network.
INTRO AND WHY
Ok guys, here is part 2 of Buying Your First Vantage. I’ve been interested in an Aston Martin, more specifically the Vantage, for the longest time. Since these exotics typically do not have a KBB/NADA value, it was hard to determine if you were getting a good deal. The market seemed to be scattered all over the place, and in some cases, as much as a 10K spread. If you are looking to buy, I hope this, along with my part 1 checklist, helps you, as it can tell you the expected cost for a given year and depreciation for the future. If you are a seller, hopefully, this can also help tell you with the price point of the market for listing. Now I know this isn’t a perfect model and the costs can be slightly off, but for the most part, I feel as if it was a great representation of current cost. It helped me negotiate with the dealer to get the price I paid. (More on that below) This is more for using this data as situational awareness and provide one of many tools to use to potentially buying your dream car.
GROUND RULES AND ASSUMPTIONS
Again, some may argue that this isn’t the best model or that there are flaws with it, true and true (my specific example on my recent purchase is below…you be the judge). Let’s cover my GR&A.
- I captured data in 2015, 2016, 2017, and 2020 (2018 & 2019 I got frustrated and gave up looking for an Aston).
- The data I collected were price, year, model, mileage, transmission, color, dealer vs private.
- The strongest correlation was price and year, so I modeled it off of that. Some will say that the model/mileage/transmission drives cost. While you are correct, the strongest correlation in data was price vs year, so I added a risk distribution around the data running a monte carlo simulation to account for the other cost drivers, so theoretically the other cost drivers should have been accounted for in the calculation somewhat.
- I collected 75-100 n sample sizes per year the data was correlated
- I tried to collect data every year in the same month to allow a full year of price depreciation to be captured.
-I mainly captured V8V and V8V Roadster data as the other models like V8VS, Rapide, DBS, V12V, and specialty series like the N400, 420, N430/GT were lacking in data and were not my primary area of interest.
METHODOLOGY
I began in 2015 and collected 75-100 samples of price, years, make, model, mileage, trans, color, dealer vs private from all over the internet. (Mainly cars.com, carguru.com jamesedition.com, Dupont, and Aston Martin dealer).
I did the same for the following years.
I looked at the data in two ways:
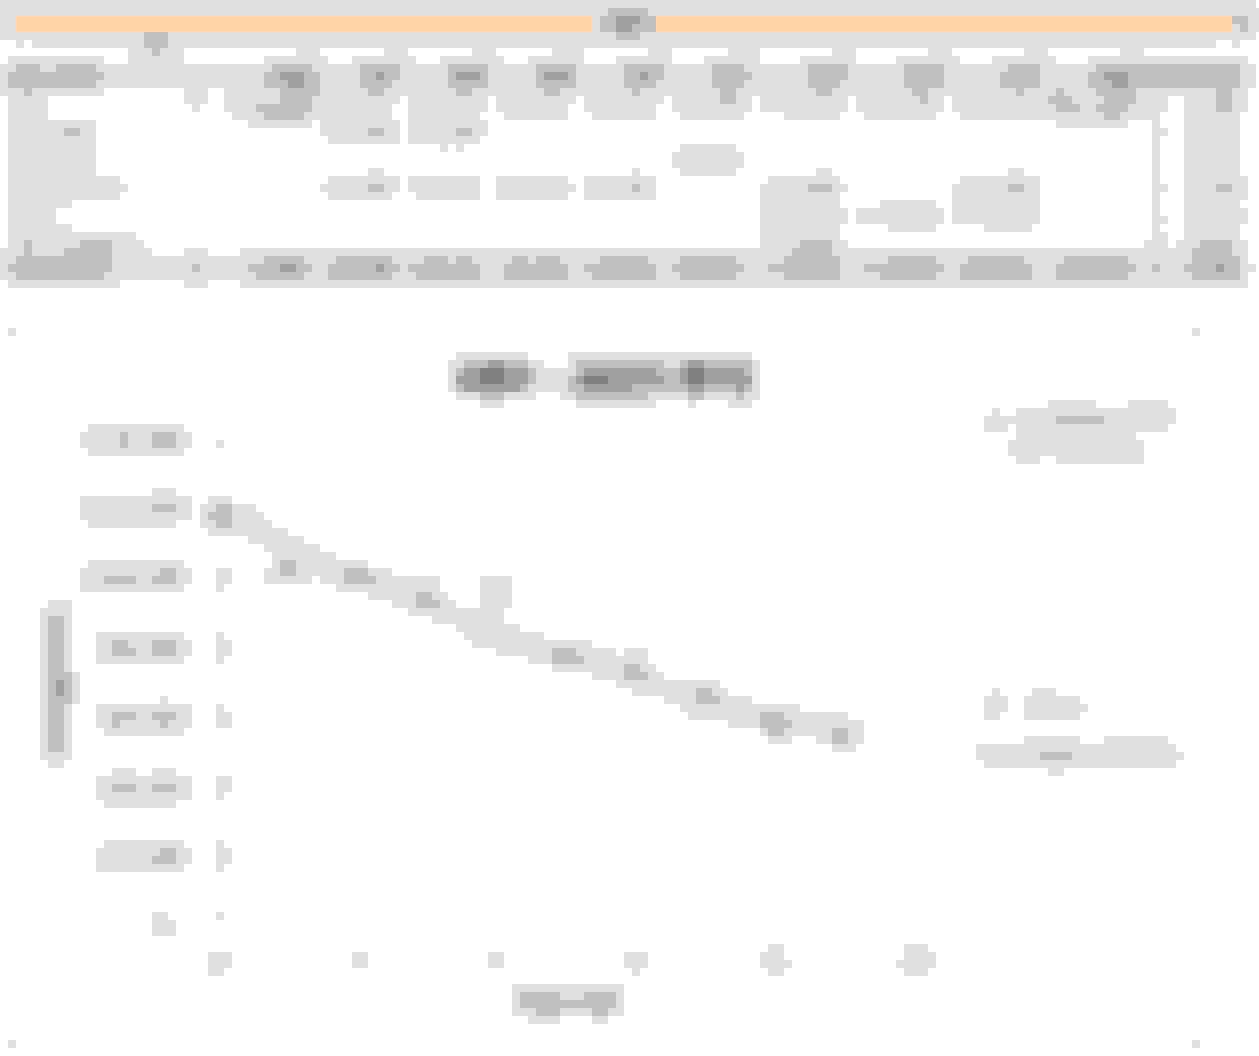
1) A single year independent of the other years. This would tell me how much a car depreciates every year. For example, in 2015, a used 2015 (year 0) was $117K and a 2006 (year 9) was $53k. (See red circle below) I used a line of best fit to predict how much an "X" year old car should be about based on this one year alone and its depreciation within the years. The data showed an average depreciation of $7K per year before flattening (We have to be careful because the $7K deprecation is linear based on actuals not based on the projected exponential equation…but should be around the same).
2) Then I had to compare data between the years to see if the numbers held true to the equation but also the market. So, in 2015, a 2009 (6-year-old) car was $72K on avg (See red circle below), with the 2015 data showing a depreciation of about $7K per year-ish. The 2016 data would show the 2009 car being $65K (time now 7-year-old car). (See Orange Circle below) So, it held true to the depreciation, but also, I could go back to the 2015 data to see if a 7-year-old car (MY2008) would be about $65K and it was close. (See Blue Circle Below)
This told me, not only was year to price correlated, but I can somewhat trust the data. Now I had to know the cars a bit to understand why some of the numbers didn't hold true. For example, 2008 and 2009 didn't hold as true because the MY2009 had a new engine that was highly sought after. So, we saw a blip in price. Also same as 2012 and 2013 where the interior was redone and highly sought after.
RESULTS AND REAL-WORLD EXAMPLE (MY EXAMPLE)
I bought a 2013 Aston Martin V8 Vantage for $59K plus delivery, title, tag, fee, etc in August 2020. Let’s look at the data.
According to the 2015 data set, a 2013 (2-year-old) V8V is averaging $100,690.
Since I bought an MY2013 in 2020 (7 Years), the 2015 data shows that a 7-year-old car (aka MY2008) should be an average of $66,640 with the line of best-fit equation showing a cost of $65,552.
Now looking at the 2016 data set, the data shows that a 7-year-old car (aka MY2009) should be an average of $65,181 with the line of best-fit equation showing a cost of $64,656. So very similar to the 2015 data.
Now looking at the 2017 data set, the data shows that a 7-year-old car (aka MY 2010) should be an average of $59,794, with the line of best-fit equation showing a cost of $59,134.
Finally, skipping to the most recent and current data set, the 2020 data, the data shows that a 7-year-old car (aka MY2013 my car year) should be an average of $55,091, with the line of best-fit equation showing a cost of $56,212.
CONCLUSION
So, what this tells me is that if I average the four data sets from above, on what a 7-year-old car should be, it averages to $61,676. (I used a basic arithmetic mean approach, probably should have used either a harmonic or geometric mean….but eh) The dealer had listed the car for $61,899 and I bought it for $59,000. To me, this was a great deal because it was under what the data was telling me. Also, it was a 1 owner, low mileage, perfect maintenance record, immaculate 6-speed manual trans. (remember these are cost drivers) Everything I wanted and the cost I was saving to pay for since I began this journey.
I had a 07 limited 357/800 STI that I had sold and invested with the sole reason to purchase an Aston. Using the data, I had at the time, I had a goal to hit ~64K to be able to afford a 2013ish Vantage around this time. So not only did this data help me target a price range I could afford for the MY I wanted, it told me what year would be the best possible year to buy (flattest part of the curve) to avoid further depreciation.
I hope that if you are in the market to buy or sell, this will help you, along with my consolidated checklist of what to look for. I know both of these tools have helped me obtain a dream car. I’m not rich, but I plan and execute to that plan. I wish everyone the best of luck and wish that you enjoy your journey on purchasing a dream car.
You have to consider the actual car at hand. An older model with excellent service and condition could sell for more than a slightly newer one with average history. A few items like leaks from engine or suspension can swing the price of the car up or down.
Very interesting info. If the analysis was based off of actual sales prices rather than asking prices it would be even more powerful, but this is good info to have nonetheless for prospective buyers!
You have to consider the actual car at hand. An older model with excellent service and condition could sell for more than a slightly newer one with average history. A few items like leaks from engine or suspension can swing the price of the car up or down.
Yes, you are correct. This is merely to give someone a baseline. Then from there, when you physically go to inspect the car and find issues, you can jump down from there. To account for the cost drivers you mentioned, I conducted a triangular risk distribution and ran a simulation to capture over/under costs.
Originally Posted by MRCW
fwiw i like to buy low and sell high...
good info. i did something similar several years ago when shopping for my vantage... not as sophisticated...
I wish I did that with my stocks...... I apparently buy high and sell low LOL.
Originally Posted by Pt1pt2
Very interesting info. If the analysis was based off of actual sales prices rather than asking prices it would be even more powerful, but this is good info to have nonetheless for prospective buyers!
I 100% agree with you, as asking can be ludacris and the final sale price is actual historical cost data. However, it is almost impossible to obtain that cost unless you look solely on ebay or maybe BAT at the sold prices.
FYSA, all PMs responded to for both part 1 and part 2
Interesting data. The biggest challenge with these cars is the wide variation in "unknown" condition. The known conditions can be factored in easily to the price (exterior, interior, drivability). The problem is the things you can't see or measure - engine condition and the like. For other makes, where the price of repair is more reasonable, these can be factored in. For an AM, telling the seller that you think the motor is going to smoke and thus you are going to factor that into the cost at full replacement will bet you a laugh and a "bye bye". Even a fully stamped book is insufficient, as the AM maintenance periods are long, and the wear modalities aren't all related to performing required maintenance. If I was going to factor in some of the unknowns, it would be # of prior owners, and average length of trip. I think that cars that have fewer owners are better loved, and cars that go 100 Km per startup are dramatically less likely to "blow up" than those that sit in the garage and then are used to drive around the block. Now how to factor that in to the pricing...
V8Vdrew Nice work! I appreciate this. Can you reply to my post with a link to part 1? I do not visit here regularly but might in the future.
Just sold my Bentley GT and have a 2021 Corvette on order. The problem with that is EVERYONE else has a deposit on a 2021 Corvette too. The wait might be as long as a year (or never as demand might already exceed 2021supply), but my patience tends to be shorter than that. If I get fed up waiting, my backup plan is another Bucket list car Either a DB9 or a V8V/ V12V. Your analysis is invaluable to me.
Interesting data. The biggest challenge with these cars is the wide variation in "unknown" condition. The known conditions can be factored in easily to the price (exterior, interior, drivability). The problem is the things you can't see or measure - engine condition and the like. For other makes, where the price of repair is more reasonable, these can be factored in. For an AM, telling the seller that you think the motor is going to smoke and thus you are going to factor that into the cost at full replacement will bet you a laugh and a "bye bye". Even a fully stamped book is insufficient, as the AM maintenance periods are long, and the wear modalities aren't all related to performing required maintenance. If I was going to factor in some of the unknowns, it would be # of prior owners, and average length of trip. I think that cars that have fewer owners are better loved, and cars that go 100 Km per startup are dramatically less likely to "blow up" than those that sit in the garage and then are used to drive around the block. Now how to factor that in to the pricing...
Thanks for posting this!
These are all great points you bring up. I started to try and find the # of owners, but without a free carfax available it was difficult and I didn't want to rule out the best-correlated data. My dataset would have been smaller than n=30. So what I did to account for those things like, # of owners and avg length of trip (which I have no idea how to track that) is I ran a triangular distribution with a Worst Case, Best Case, and Most Likely. These bounds were determined by the furthest bounds (outliers) for the price of a given car in a given year. The data showed a left-skewed triangle distribution where I then ran a Monte Carlo to simulate 1000 iterations of random sampling. Therefore, it moved my point estimate (aka most likely average cost of a given Model Vantage) to the right and increased the price. The values you see above are not point estimates rather a risk-adjusted value to account for the slight unknowns. This model cannot plan for earthquakes and catastrophic failures but does take into account for some unknowns that are cost drivers.
Originally Posted by BWings
V8Vdrew Nice work! I appreciate this. Can you reply to my post with a link to part 1? I do not visit here regularly but might in the future.
Just sold my Bentley GT and have a 2021 Corvette on order. The problem with that is EVERYONE else has a deposit on a 2021 Corvette too. The wait might be as long as a year (or never as demand might already exceed 2021supply), but my patience tends to be shorter than that. If I get fed up waiting, my backup plan is another Bucket list car Either a DB9 or a V8V/ V12V. Your analysis is invaluable to me.
Nice Drew! Pretty sure what your background is. Good job. I enjoy a technical piece from time to time. But c’mon dude, this is 6speed not your ASA or Kaggle or SO!
You did all this on Excel?
One thing I would say is a clearer take away in your conclusion: “Do this to derive a $X for your next negotiation deal for a car from this model year”. Or “Use formula A if buying from a dealer or formula B for a private party”. Better yet, set up a UI with inputs and produce an output etc.
Haha it was a geek/nerd out session with data. Really wasn't sure if it was going to work or not, but since it helped me tremendously, I thought someone else could use it. I'm not by any means wealthy, so planning and executing is key for me.
I modeled it in ACEIT/At-Risk which is a subset of excel. I just exported to excel so that it was easier to interface with. I would agree 100% with your conclusion. For future year, you can use it to predict a certain MY you are looking for, and how much to save for it. Also, when the best time to buy one as it comes down on the curve. If you are selling, it could help with a listing price and when to potentially dump the car before losing value. I would say that the data was 90% dealer and 10% private listing, so the majority of the data represents dealer listings.
I love the idea of a UI where users can just input a year they are interested and everything is calculated for them with multiple views. For right now, lots of people have PMd and asked me to run a sim or just sent me a listing to see what my thoughts were. I may release the model if I have some time to work on it.
Interesting discussion. Thanks again Drew - you need to capitalize on your simulator and start some type of cottage industry for prospective buyers to help you pay for your NEXT Vantage!
Interesting discussion. Thanks again Drew - you need to capitalize on your simulator and start some type of cottage industry for prospective buyers to help you pay for your NEXT Vantage!
You're more than welcome. Best of luck and feel free to keep reaching out.
Maybe if there was a huge market for this type of analysis hahaha but I'm glad it will help whoever needs it.
Well, it's that time of year again. Every August, I collect data on Aston Martins for sale (mainly V8V) to see how the market is doing.
I don't think it's any surprise that the cars are starting to appreciate, but I wanted to confirm with data and how much.
Things I've noticed:
1) On average every year, I usually have about 100 data points (cars for sale), this year I had less than 50. Barely enough to call it a sample. That tells me demands are up, thus further driving costs up
2) The appreciation was much higher on average than I was expecting.
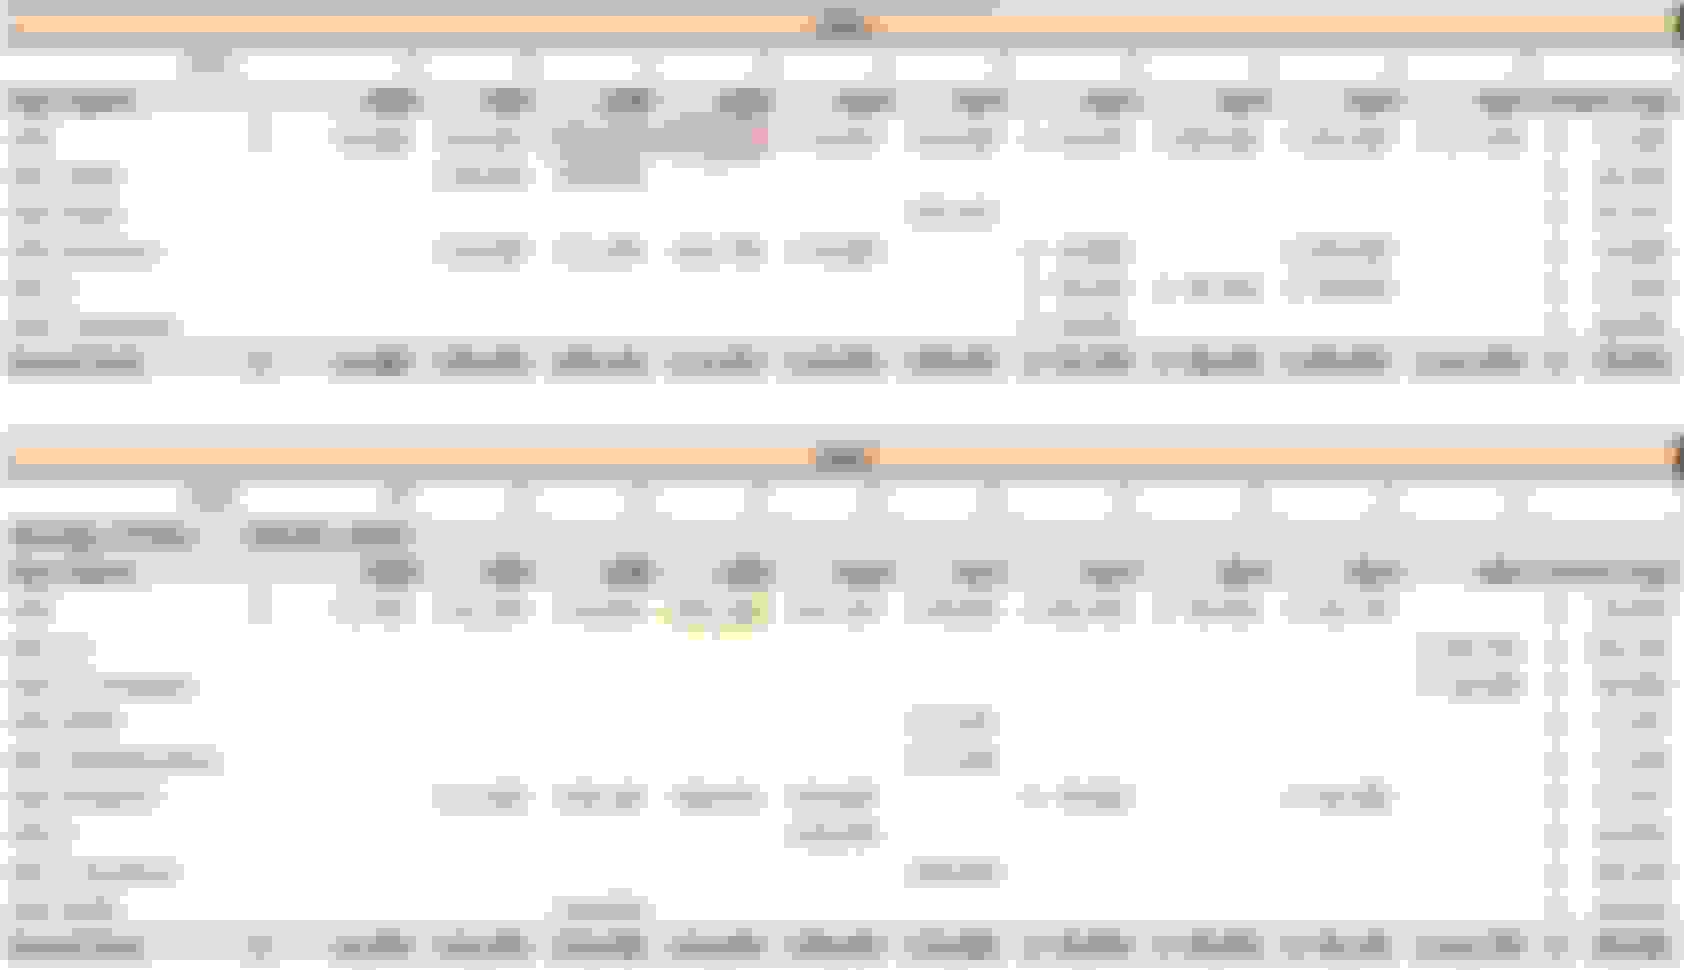
For this year's data, I show the trends for each MY (2006 to ~ 2014).
They all show the bathtub curve, as this year was the start of the appreciation for every MY.
The older MY had the smallest projected depreciation (as it should as they are at the lowest point of the curve), and the latter MY showed the largest depreciation projections.
The average appreciation from this year was all over the map and with not enough data points, it was hard to normalize and characterize the trends.
The Delta is what you would be paying over and beyond if you were buying this year. For example, MY 2006 should have depreciated around 3,700 from last year's average, however, the cars appreciated on average 5,400, therefore, what should have been 3700 less is now 9,100 more.
Following the MY2006 example with real dollars:
In 2020 the average 2006 sold for $42,492.
Based on the exponential depreciation curve, in 2021 this car should have been sold for around $38,792.
Instead, the 2021 average was $47,985.
Therefore, you would have paid $9,193 over what you should have really paid if it was not for this weird market. (Post COVID)
Overall, if you are looking to buy, depending on the MY, be prepared to pay well over what the market should be. If you are selling, this is nice to price yours competitvely.
Well, it's that time of year again. Every August, I collect data on Aston Martins for sale (mainly V8V) to see how the market is doing.
I don't think it's any surprise that the cars are starting to appreciate, but I wanted to confirm with data and how much.
Things I've noticed:
1) On average every year, I usually have about 100 data points (cars for sale), this year I had less than 50. Barely enough to call it a sample. That tells me demands are up, thus further driving costs up
2) The appreciation was much higher on average than I was expecting.
For this year's data, I show the trends for each MY (2006 to ~ 2014).
They all show the bathtub curve, as this year was the start of the appreciation for every MY.
The older MY had the smallest projected depreciation (as it should as they are at the lowest point of the curve), and the latter MY showed the largest depreciation projections.
The average appreciation from this year was all over the map and with not enough data points, it was hard to normalize and characterize the trends.
The Delta is what you would be paying over and beyond if you were buying this year. For example, MY 2006 should have depreciated around 3,700 from last year's average, however, the cars appreciated on average 5,400, therefore, what should have been 3700 less is now 9,100 more.
Following the MY2006 example with real dollars:
In 2020 the average 2006 sold for $42,492.
Based on the exponential depreciation curve, in 2021 this car should have been sold for around $38,792.
Instead, the 2021 average was $47,985.
Therefore, you would have paid $9,193 over what you should have really paid if it was not for this weird market. (Post COVID)
Overall, if you are looking to buy, depending on the MY, be prepared to pay well over what the market should be. If you are selling, this is nice to price yours competitvely.
 10-03-2020, 06:17 AM


 I apparently buy high and sell low LOL.